
Introduction: The Power of Data in Modern Recruitment
In today’s world, data is the engine driving better decisions in every business sector, including recruitment. Gone are the days when companies had to rely on gut feelings or traditional approaches to hiring. With access to real-time data and recruitment metrics, businesses can take a proactive approach to building their teams, minimizing bias, improving candidate quality, and speeding up the hiring process.
In fast-moving, high-turnover industries—especially commission-based sectors like sales, solar, and retail—the need for data-driven recruitment decisions is even more pronounced. In these sectors, time-to-hire, pipeline velocity, and candidate quality are directly linked to business performance and revenue generation. Delays or inefficiencies in hiring can have a significant negative impact on overall success.
Why Data is Essential in Recruitment
1. Moving from Intuition to Data-Driven Decisions
Recruitment used to be a field dominated by subjective factors—gut instincts, personal interviews, and impressions. However, this method is both risky and inefficient, especially when hiring at scale. Data has revolutionized recruitment by providing quantifiable insights into every stage of the hiring process, from sourcing to onboarding.
Using real-time data ensures that companies:
- Hire faster by identifying bottlenecks in the hiring process.
- Improve candidate quality by evaluating performance metrics.
- Reduce turnover by hiring candidates who are a better fit for the role and company culture.
2. Why Real-Time Data is Key
In today’s competitive job market, real-time recruitment metrics provide a clear, up-to-date picture of your hiring process. In industries where open positions can lead to missed sales opportunities or higher workloads for existing employees, delays in hiring need to be addressed immediately.
- Real-time data gives you insights into which roles are getting stuck in the hiring pipeline.
- It highlights inefficiencies in your recruitment process, allowing for quick adjustments.
- It helps businesses forecast recruitment needs based on historical trends and pipeline velocity.
Example: If a company notices a drop-off in candidate engagement between the interview and offer stages, real-time data allows recruiters to pinpoint this issue as it occurs, enabling immediate adjustments like quicker feedback or faster decision-making.
Key Recruitment Metrics to Track
The value of data lies in knowing which metrics to track and how they influence hiring decisions. Below are some of the most critical recruitment metrics that drive better hiring outcomes:
1. Time-to-Hire
One of the most important metrics for fast-moving industries is time-to-hire—the time it takes from opening a position to getting a signed offer from a candidate. The longer this process takes, the higher the risk of losing top talent to competitors or experiencing disruptions in business operations.
- How to use it: If time-to-hire is too long, businesses can evaluate specific stages where bottlenecks occur (screening, interviews, decision-making) and implement tools to speed up these processes.
- Impact: Shortening time-to-hire directly correlates with better candidate engagement and reduced hiring costs.
2. Cost-per-Hire
Cost-per-hire measures the total amount spent on hiring a new employee, including advertising costs, agency fees, salaries for recruiters, and time spent on the hiring process. High costs per hire can indicate inefficiencies and misallocated resources.
3. Candidate Quality
One of the more subjective but highly valuable metrics is candidate quality. This metric assesses how well new hires perform over time. By tracking how well candidates meet expectations in their roles, businesses can measure the success of their recruitment efforts.
- How to use it: By tracking the performance of new hires and comparing it to recruitment sources or interview feedback, businesses can adjust their recruitment strategies to focus on sourcing high-performing candidates.
- Impact: Higher candidate quality reduces turnover and increases productivity, which is essential for roles like commission-based sales where performance is directly tied to business success.
4. Offer Acceptance Rate
The offer acceptance rate tracks how many candidates accept job offers versus those who decline. A low offer acceptance rate could indicate issues with compensation packages, company culture, or candidate experience.
- How to use it: Tracking this metric helps identify why candidates may be rejecting offers, allowing businesses to make adjustments to their recruitment packages or negotiation tactics.
- Impact: Improving the offer acceptance rate leads to a smoother recruitment process and higher candidate satisfaction.
5. Candidate Drop-Off Rate
Another critical metric is the candidate drop-off rate, which measures how many applicants abandon the hiring process before it is complete. This can occur due to long application processes, lack of communication, or delays in scheduling interviews.
- How to use it: High drop-off rates often point to flaws in the recruitment funnel, such as complicated forms or inefficient scheduling. By tracking these drop-off points, businesses can optimize the candidate experience.
- Impact: Lower drop-off rates ensure a fuller candidate pipeline, improving the chances of finding the right hire quickly.
Real-Time Dashboards: A Game-Changer for Recruitment
Tracking metrics manually can be overwhelming, especially in high-volume recruitment environments. That’s why real-time dashboards have become a critical tool for businesses looking to optimize their hiring process.
1. Visualizing the Recruitment Funnel
Real-time recruitment dashboards provide hiring managers with a visual representation of their hiring funnel, from candidate sourcing to offer acceptance. These dashboards allow businesses to monitor the progress of candidates through different stages, ensuring pipeline velocity and identifying potential delays.
- Example: A real-time dashboard might show that a significant portion of candidates is getting stuck at the interview stage, signaling the need for faster interview scheduling or quicker feedback from interviewers.
2. Spotting Bottlenecks in Real Time
One of the main benefits of real-time dashboards is the ability to identify bottlenecks as they occur. Whether it’s a delay in screening resumes, scheduling interviews, or obtainingfeedback from decision-makers, real-time data allows businesses to address these issues immediately.
- Impact: By eliminating bottlenecks, businesses can significantly reduce time-to-hire and ensure that top candidates don’t lose interest in the position.
3. Tracking Pipeline Velocity
Pipeline velocity refers to how quickly candidates move through the recruitment funnel. By tracking this in real-time, businesses can ensure that candidates are not left waiting in limbo, which improves the candidate experience and increases the likelihood of a successful hire.
- Example: If candidates move from application to interview quickly, but there’s a delay in decision-making after interviews, recruiters can focus on improving the feedback loop between interviewers and hiring managers.
4. Predictive Analytics for Proactive Recruitment
Beyond tracking current metrics, many recruitment platforms now offer predictive analytics. This allows businesses to anticipate future recruitment needs based on historical trends. For example, if a company experiences high turnover in sales roles every 12 months, predictive analytics can help them prepare for future hiring cycles by building a candidate pipeline in advance.
How Scale by Sequifi Leverages Real-Time Data
Scale by Sequifi offers businesses the ability to monitor and optimize their recruitment processes using real-time data and customizable metrics. Here’s how it helps businesses make better hiring decisions:
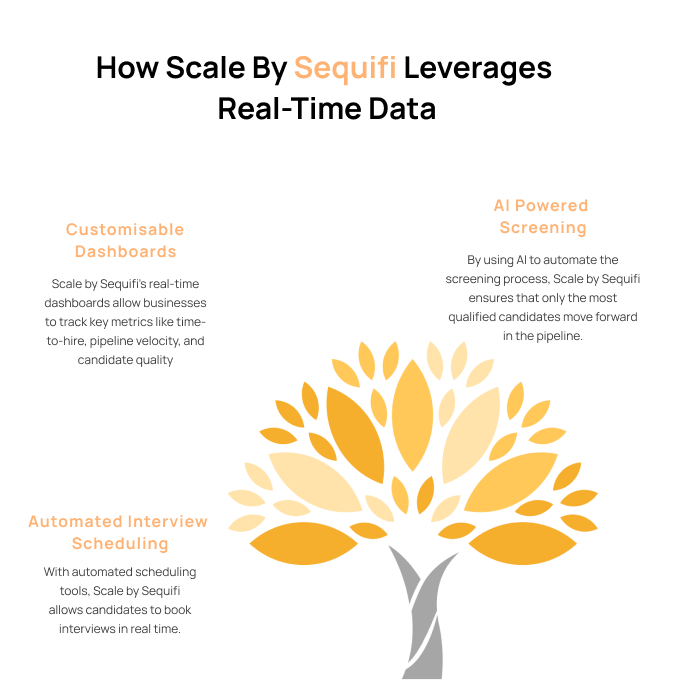
1. Customizable Dashboards
Scale by Sequifi’s real-time dashboards allow businesses to track key metrics like time-to-hire, pipeline velocity, and candidate quality. These dashboards are fully customizable, so businesses can focus on the metrics that matter most to their specific hiring needs.
2. AI-Powered Screening
By using AI to automate the screening process, Scale by Sequifi ensures that only the most qualified candidates move forward in the pipeline. This reduces the amount of time recruiters spend manually reviewing resumes and increases the overall efficiency of the recruitment process.
3. Automated Interview Scheduling
Interview scheduling is often one of the biggest bottlenecks in the recruitment process. With automated scheduling tools, Scale by Sequifi allows candidates to book interviews in real time, eliminating the delays caused by back-and-forth coordination.
4. Real-Time Insights for Faster Decision-Making
By providing real-time insights into every stage of the hiring funnel, Scale by Sequifi helps businesses make data-driven decisions faster. Whether it’s deciding which candidates to move forward or identifying bottlenecks in the pipeline, real-time.analytics empower teams to optimize their recruitment process with precision. Scale by Sequifi delivers actionable insights that streamline hiring, reduce time-to-fill, and improve overall recruitment efficiency. With instant visibility into candidate progress and pipeline performance, businesses can stay agile and responsive in a competitive talent market.