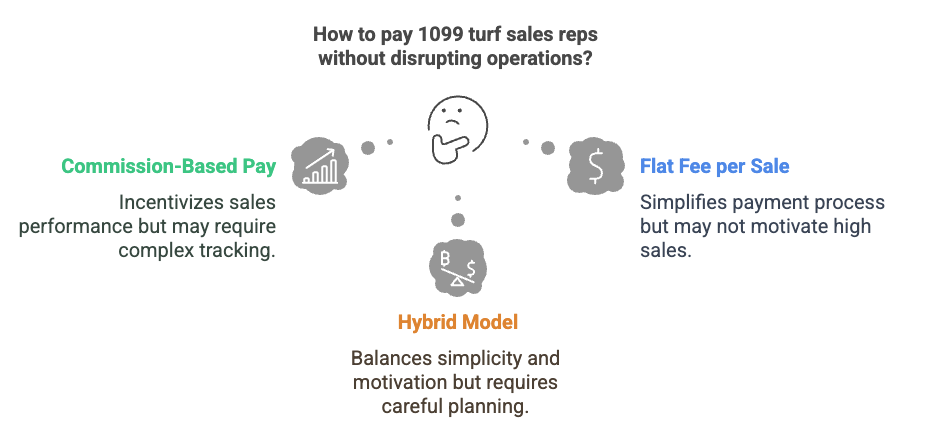
Sequifi Blog
  • Commission Calculation
  • HR Management
  • Payroll Processing
  • Sales Reporting
Sequifi Blog
  • Commission Calculation
  • HR Management
  • Payroll Processing
  • Sales Reporting
Infographic titled “Essential Tools for Mobile Sales Reps” showing a funnel-shaped diagram with five horizontal layers, each representing a tool category. From top to bottom: CRM Software – Manages customer interactions and data (blue). Mobile Sales Apps – Facilitates sales tasks on the go (green). GPS Tracking – Monitors location and travel routes (light green). Communication Tools – Enables instant communication with team (yellow). Data Analytics – Provides insights into sales performance (orange). Icons next to each layer visually represent the function.
Commission Calculation HR Management Payroll Processing Recruitment Sales Reporting

5 Mobile Sales Rep Tools Every Field Rep Should Be Using This Summer

Tessa Van der ploeg
  • June 5, 2025
  • 4 min read
Read Post
Circular infographic titled “Real-Time Sales Accountability Cycle,” centered around a real-time sales dashboard. The cycle includes four stages: Monitor Sales Performance Identify Areas for Improvement Implement Strategies Evaluate Results Each stage is represented with a corresponding icon, illustrating how a real-time sales dashboard supports continuous performance tracking and accountability.
Commission Calculation HR Management Sales Reporting

The Real-Time Sales Dashboard That Keeps Your Reps Accountable

Roshan Kumar
  • June 3, 2025
  • 5 min read
Read Post
Circular diagram illustrating the cycle of sales rep payroll problems, including inaccurate data collection, manual calculation errors, delayed payments, employee dissatisfaction, high turnover rates, and increased costs.
Commission Calculation Sales Reporting

Why Sales Rep Payroll Is Still Broken (and No One’s Talking About It)

Tessa Van der ploeg
  • May 29, 2025
  • 4 min read
Read Post

More Featured Posts.

Commission Calculation HR Management Payroll Processing Recruitment Sales Reporting

5 Mobile Sales Rep Tools Every Field Rep Should Be Using This Summer

Tessa Van der ploeg
  • June 5, 2025
  • 4 min read
Infographic titled “Essential Tools for Mobile Sales Reps” showing a funnel-shaped diagram with five horizontal layers, each representing a tool category. From top to bottom: CRM Software – Manages customer interactions and data (blue). Mobile Sales Apps – Facilitates sales tasks on the go (green). GPS Tracking – Monitors location and travel routes (light green). Communication Tools – Enables instant communication with team (yellow). Data Analytics – Provides insights into sales performance (orange). Icons next to each layer visually represent the function.
Commission Calculation HR Management Sales Reporting

The Real-Time Sales Dashboard That Keeps Your Reps Accountable

Roshan Kumar
  • June 3, 2025
  • 5 min read
Circular infographic titled “Real-Time Sales Accountability Cycle,” centered around a real-time sales dashboard. The cycle includes four stages: Monitor Sales Performance Identify Areas for Improvement Implement Strategies Evaluate Results Each stage is represented with a corresponding icon, illustrating how a real-time sales dashboard supports continuous performance tracking and accountability.

Most Popular

  • Commisssion Calulation
  • HR Management
  • Sales Reporting
  • Payroll Processing
01
Commission Calculation HR Management Payroll Processing Recruitment Sales Reporting

5 Mobile Sales Rep Tools Every Field Rep Should Be Using This Summer

Tessa Van der ploeg
  • June 5, 2025
  • 4 min read
Infographic titled “Essential Tools for Mobile Sales Reps” showing a funnel-shaped diagram with five horizontal layers, each representing a tool category. From top to bottom: CRM Software – Manages customer interactions and data (blue). Mobile Sales Apps – Facilitates sales tasks on the go (green). GPS Tracking – Monitors location and travel routes (light green). Communication Tools – Enables instant communication with team (yellow). Data Analytics – Provides insights into sales performance (orange). Icons next to each layer visually represent the function.
02
Commission Calculation HR Management Sales Reporting

The Real-Time Sales Dashboard That Keeps Your Reps Accountable

Roshan Kumar
  • June 3, 2025
  • 5 min read
Circular infographic titled “Real-Time Sales Accountability Cycle,” centered around a real-time sales dashboard. The cycle includes four stages: Monitor Sales Performance Identify Areas for Improvement Implement Strategies Evaluate Results Each stage is represented with a corresponding icon, illustrating how a real-time sales dashboard supports continuous performance tracking and accountability.
03
Commission Calculation Sales Reporting

Why Sales Rep Payroll Is Still Broken (and No One’s Talking About It)

Tessa Van der ploeg
  • May 29, 2025
  • 4 min read
Circular diagram illustrating the cycle of sales rep payroll problems, including inaccurate data collection, manual calculation errors, delayed payments, employee dissatisfaction, high turnover rates, and increased costs.
04
Commission Calculation Payroll Processing Sales Reporting

Real-Time Pay Transparency: What Your Best Reps Expect (and Why It Lowers Turnover)

Tessa Van der ploeg
  • May 22, 2025
  • 4 min read
Infographic comparing Real-Time Pay Transparency with Traditional Pay Secrecy using a seesaw graphic. On the left, Real-Time Pay Transparency leads to lower turnover rates and increased employee satisfaction (depicted with a blue, elevated scale). On the right, Traditional Pay Secrecy results in higher turnover rates and decreased satisfaction (shown with a red, lowered scale). Caption below reads: "Transparency boosts satisfaction and retention."
01
Commission Calculation HR Management Payroll Processing Recruitment Sales Reporting

5 Mobile Sales Rep Tools Every Field Rep Should Be Using This Summer

Tessa Van der ploeg
  • June 5, 2025
  • 4 min read
Infographic titled “Essential Tools for Mobile Sales Reps” showing a funnel-shaped diagram with five horizontal layers, each representing a tool category. From top to bottom: CRM Software – Manages customer interactions and data (blue). Mobile Sales Apps – Facilitates sales tasks on the go (green). GPS Tracking – Monitors location and travel routes (light green). Communication Tools – Enables instant communication with team (yellow). Data Analytics – Provides insights into sales performance (orange). Icons next to each layer visually represent the function.
02
Commission Calculation HR Management Sales Reporting

The Real-Time Sales Dashboard That Keeps Your Reps Accountable

Roshan Kumar
  • June 3, 2025
  • 5 min read
Circular infographic titled “Real-Time Sales Accountability Cycle,” centered around a real-time sales dashboard. The cycle includes four stages: Monitor Sales Performance Identify Areas for Improvement Implement Strategies Evaluate Results Each stage is represented with a corresponding icon, illustrating how a real-time sales dashboard supports continuous performance tracking and accountability.
03
HR Management

Boost Productivity with AI-Driven Workflow Automation

Tessa Van der ploeg
  • May 15, 2025
  • 4 min read
A colorful infographic titled "Transforming Workflows with AI," featuring four interconnected chain links, each labeled with a key benefit of AI-driven workflow automation: Streamlined Processes (blue) – Simplifies and accelerates workflows Reduced Manual Tasks (teal) – Minimizes human effort in routine tasks Strategic Focus (green) – Enables teams to concentrate on high-level goals Operational Optimization (yellow) – Enhances efficiency and productivity
04
HR Management Payroll Processing

From Chaos to Clarity: How HR and Payroll Automation Fuels Growth

Tessa Van der ploeg
  • May 14, 2025
  • 4 min read
01
Commission Calculation HR Management Payroll Processing Recruitment Sales Reporting

5 Mobile Sales Rep Tools Every Field Rep Should Be Using This Summer

Tessa Van der ploeg
  • June 5, 2025
  • 4 min read
Infographic titled “Essential Tools for Mobile Sales Reps” showing a funnel-shaped diagram with five horizontal layers, each representing a tool category. From top to bottom: CRM Software – Manages customer interactions and data (blue). Mobile Sales Apps – Facilitates sales tasks on the go (green). GPS Tracking – Monitors location and travel routes (light green). Communication Tools – Enables instant communication with team (yellow). Data Analytics – Provides insights into sales performance (orange). Icons next to each layer visually represent the function.
02
Commission Calculation HR Management Sales Reporting

The Real-Time Sales Dashboard That Keeps Your Reps Accountable

Roshan Kumar
  • June 3, 2025
  • 5 min read
Circular infographic titled “Real-Time Sales Accountability Cycle,” centered around a real-time sales dashboard. The cycle includes four stages: Monitor Sales Performance Identify Areas for Improvement Implement Strategies Evaluate Results Each stage is represented with a corresponding icon, illustrating how a real-time sales dashboard supports continuous performance tracking and accountability.
03
Commission Calculation Sales Reporting

Why Sales Rep Payroll Is Still Broken (and No One’s Talking About It)

Tessa Van der ploeg
  • May 29, 2025
  • 4 min read
Circular diagram illustrating the cycle of sales rep payroll problems, including inaccurate data collection, manual calculation errors, delayed payments, employee dissatisfaction, high turnover rates, and increased costs.
04
Commission Calculation Payroll Processing Sales Reporting

Real-Time Pay Transparency: What Your Best Reps Expect (and Why It Lowers Turnover)

Tessa Van der ploeg
  • May 22, 2025
  • 4 min read
Infographic comparing Real-Time Pay Transparency with Traditional Pay Secrecy using a seesaw graphic. On the left, Real-Time Pay Transparency leads to lower turnover rates and increased employee satisfaction (depicted with a blue, elevated scale). On the right, Traditional Pay Secrecy results in higher turnover rates and decreased satisfaction (shown with a red, lowered scale). Caption below reads: "Transparency boosts satisfaction and retention."
01
Commission Calculation HR Management Payroll Processing Recruitment Sales Reporting

5 Mobile Sales Rep Tools Every Field Rep Should Be Using This Summer

Tessa Van der ploeg
  • June 5, 2025
  • 4 min read
Infographic titled “Essential Tools for Mobile Sales Reps” showing a funnel-shaped diagram with five horizontal layers, each representing a tool category. From top to bottom: CRM Software – Manages customer interactions and data (blue). Mobile Sales Apps – Facilitates sales tasks on the go (green). GPS Tracking – Monitors location and travel routes (light green). Communication Tools – Enables instant communication with team (yellow). Data Analytics – Provides insights into sales performance (orange). Icons next to each layer visually represent the function.
02
Commission Calculation Payroll Processing Sales Reporting

Real-Time Pay Transparency: What Your Best Reps Expect (and Why It Lowers Turnover)

Tessa Van der ploeg
  • May 22, 2025
  • 4 min read
Infographic comparing Real-Time Pay Transparency with Traditional Pay Secrecy using a seesaw graphic. On the left, Real-Time Pay Transparency leads to lower turnover rates and increased employee satisfaction (depicted with a blue, elevated scale). On the right, Traditional Pay Secrecy results in higher turnover rates and decreased satisfaction (shown with a red, lowered scale). Caption below reads: "Transparency boosts satisfaction and retention."
03
Payroll Processing

Multi-State Payroll Made Easy: How to Stay Compliant and Scale Smart

Aviral Bhutani
  • May 16, 2025
  • 4 min read
Diagram illustrating how to manage multi-state payroll effectively, featuring automation, compliance, and overhead reduction strategies.
04
HR Management Payroll Processing

From Chaos to Clarity: How HR and Payroll Automation Fuels Growth

Tessa Van der ploeg
  • May 14, 2025
  • 4 min read
Sequifi Blog
Follow us

© 2024. All rights reserved by Sequifi.